Qatch ondersteuningscentrum
Hier vindt u onze productdocumentatie en standaard werkprocedures.
Analytics
Admin can check all the trip details in Analytics with a graphical representation of all the data.
The Analytics tab is on the top of all the tabs in the left-hand sidebar.
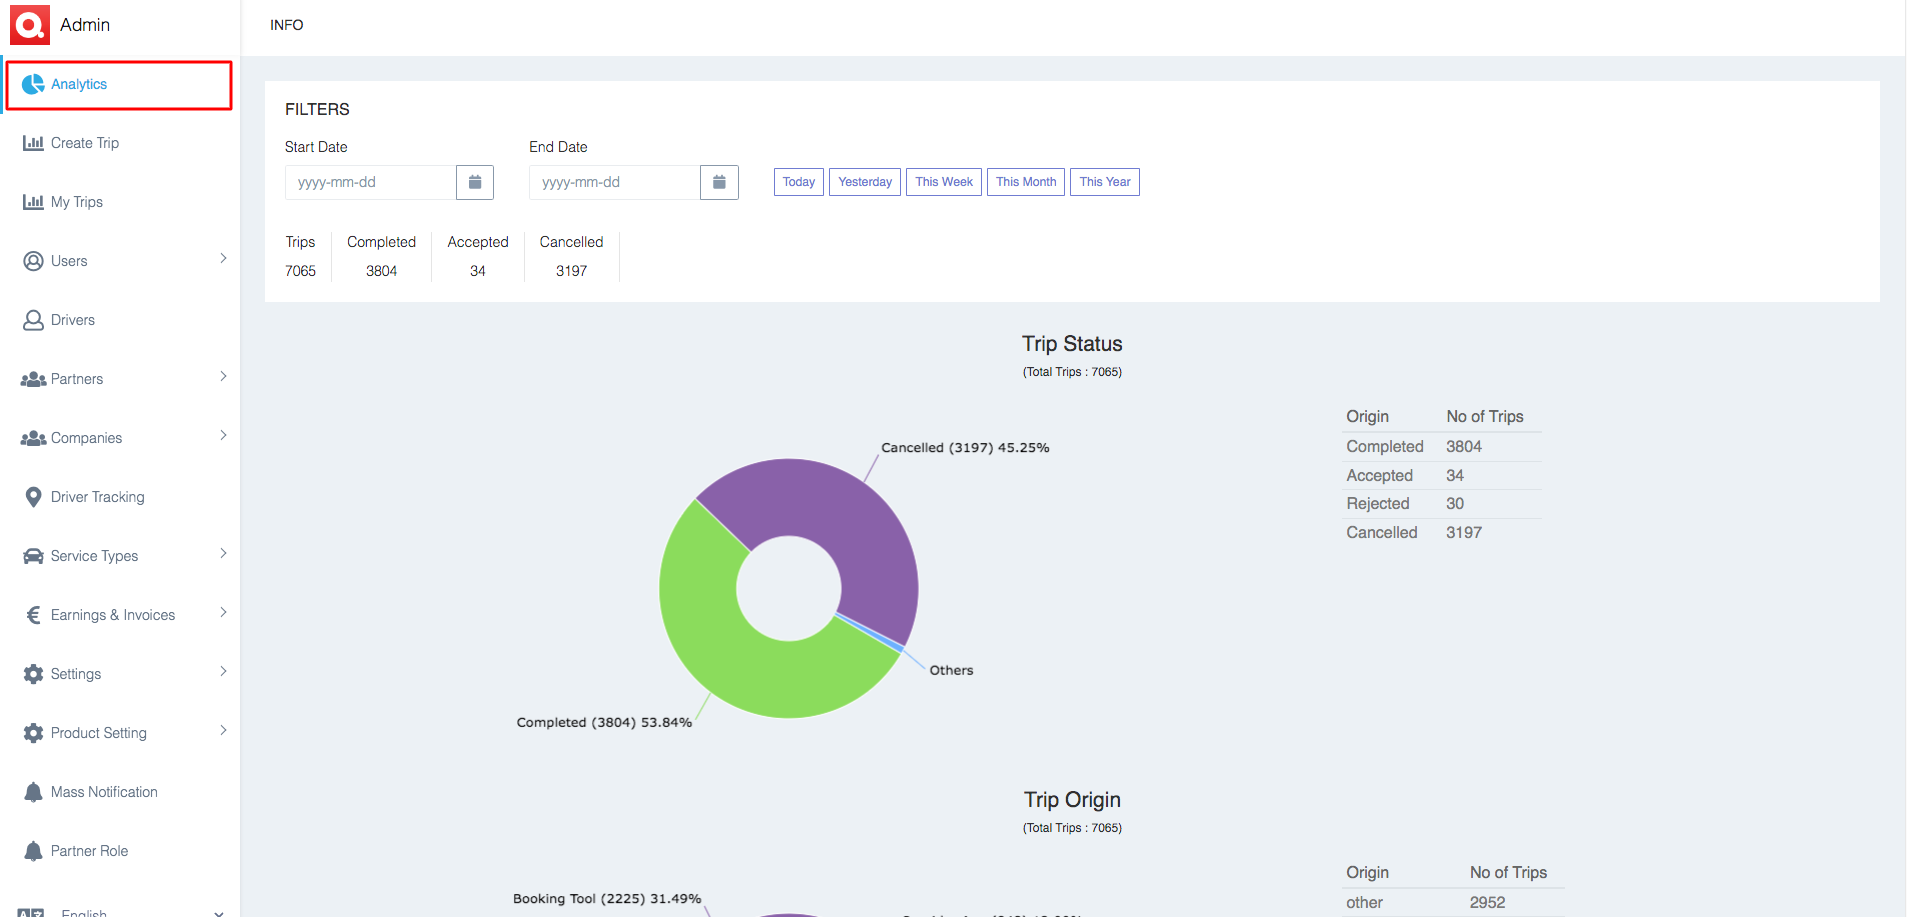
- At the top of the page, we have Filters to get accurate data.
- Admin can select Start Date and End Date to get data between those two dates.
- Besides that, there are 5 buttons, including, Today, Yesterday, This Week, This Month, and This Year. You can press any of those to find detailed data about the trip.
- After that, you can see the Total Number of trips, and Completed, Accepted, and Cancelled trips.
- Below the filters, there are five types of data are mentioned, which include the following,
1.Trip Status
- In this section, all precise details of the trip status are mentioned in graphical form with the Number of Trips and Percentage (%) of a particular status.
- The data includes the total number of Completed, Accepted , Rejected, and Canceled trips.

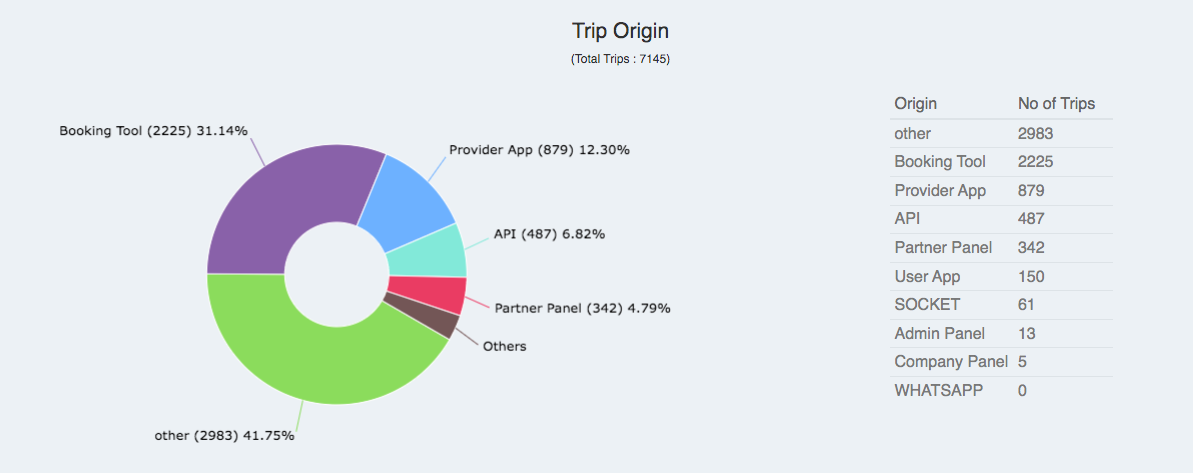
2.Trip Origin
- In the Trip Origin portion, the details are displayed for the entire number of trips generated by a separate Booking Tool, Provider App, API, Partner Panel, User App, SOCKET, Admin Panel, Company Panel, WHATSAPP, and Other origins.
- The data also shows the exact numbers of how many trips each individual creates.
- Besides showing the digital data of the total number of trips booked, it also shows the graphical representation of this real data.
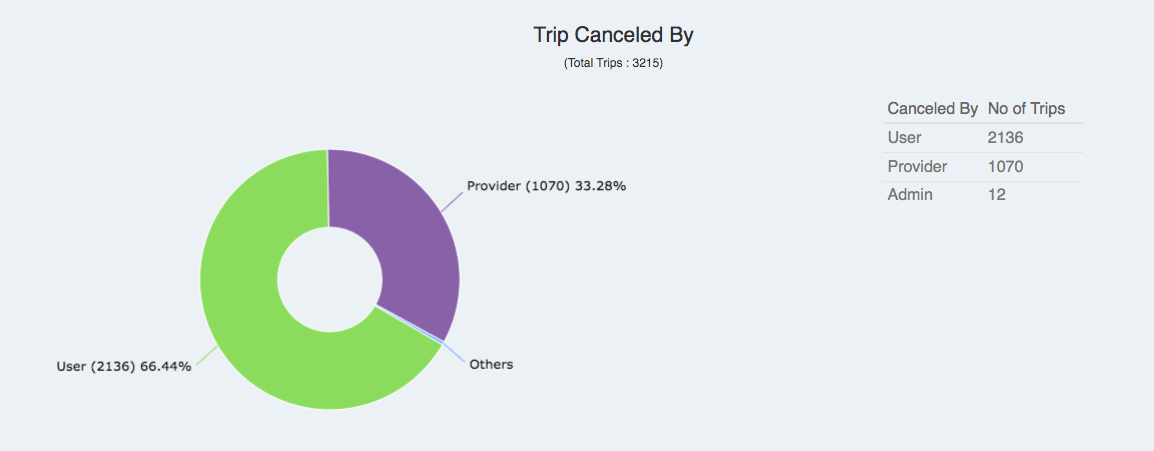
3.Trip Canceled By
- This section shows the total number of Canceled Trips by User , , and, Admin in digital and graphical form.
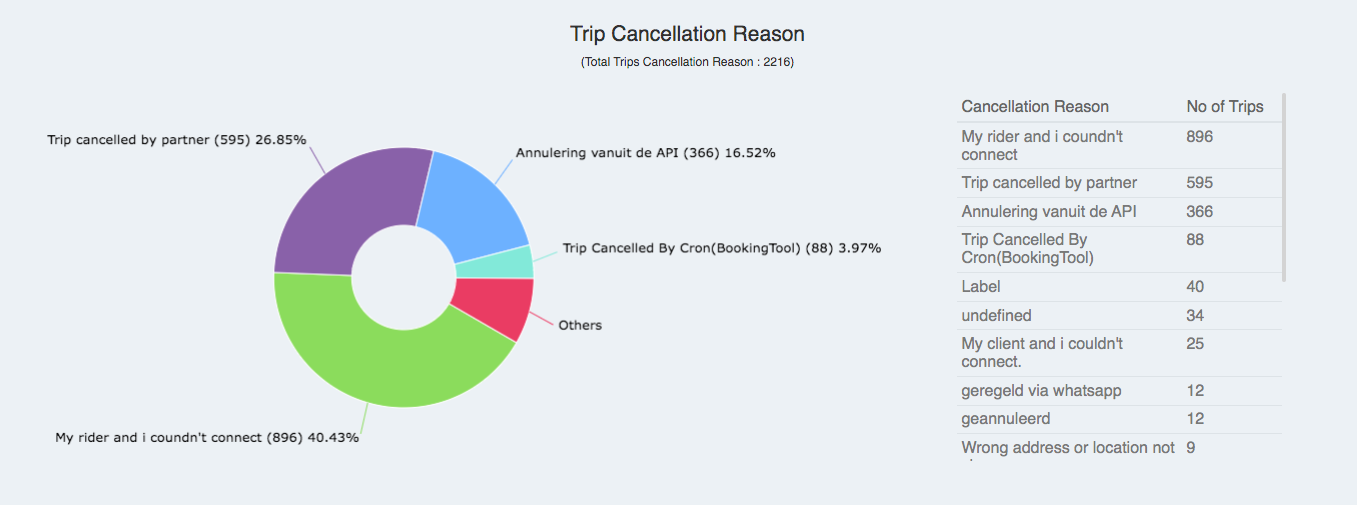
4.Trip Cancellation Reason
- This section shows the Trip Cancellation Reasons .
- Whenever the driver, user, or admin cancels the trip, they need to select the cancellation reason from the list or place a custom reason manually.
- Those reasons are displayed here with the total number of occurrences and also a graph with the percentage of data.
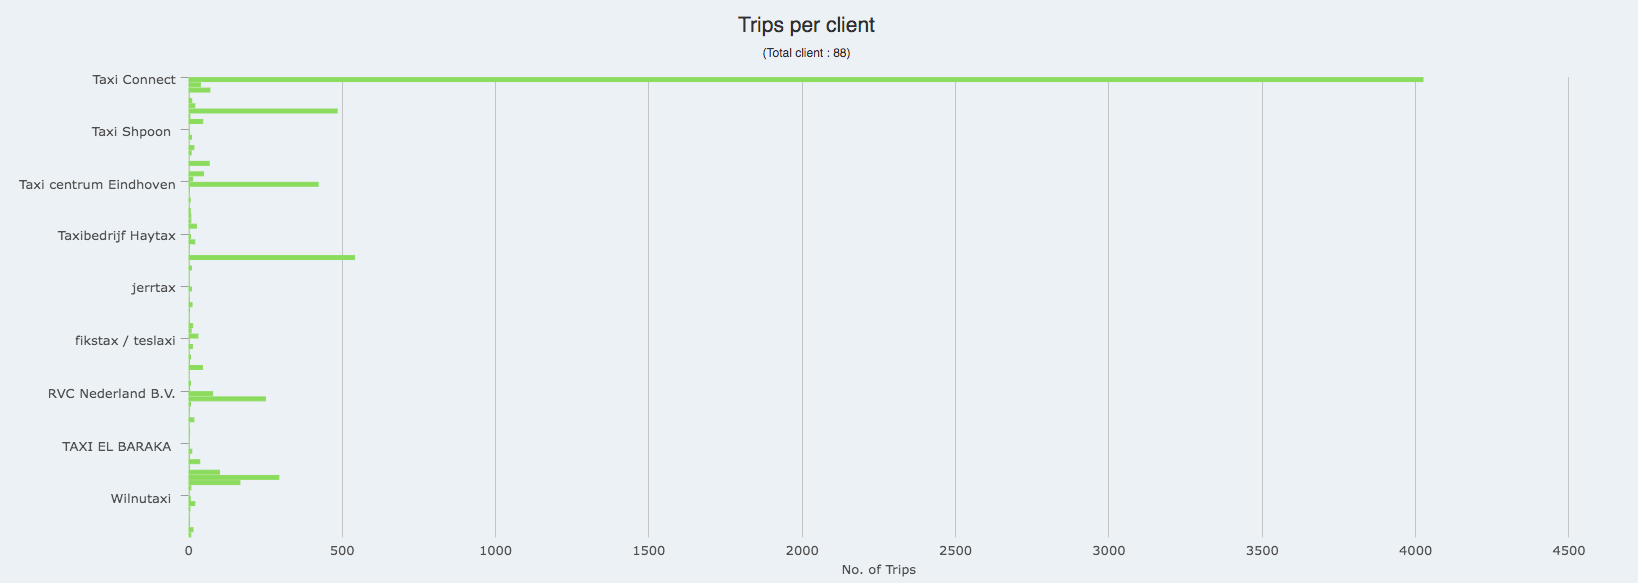
5.Trips Per Client
- This last section shows the total number of clients of the app and the number of trips they have successfully made to the current date.
- This entire data is displayed in graphical form. You can zoom in and out on the graph to see details more accurately.